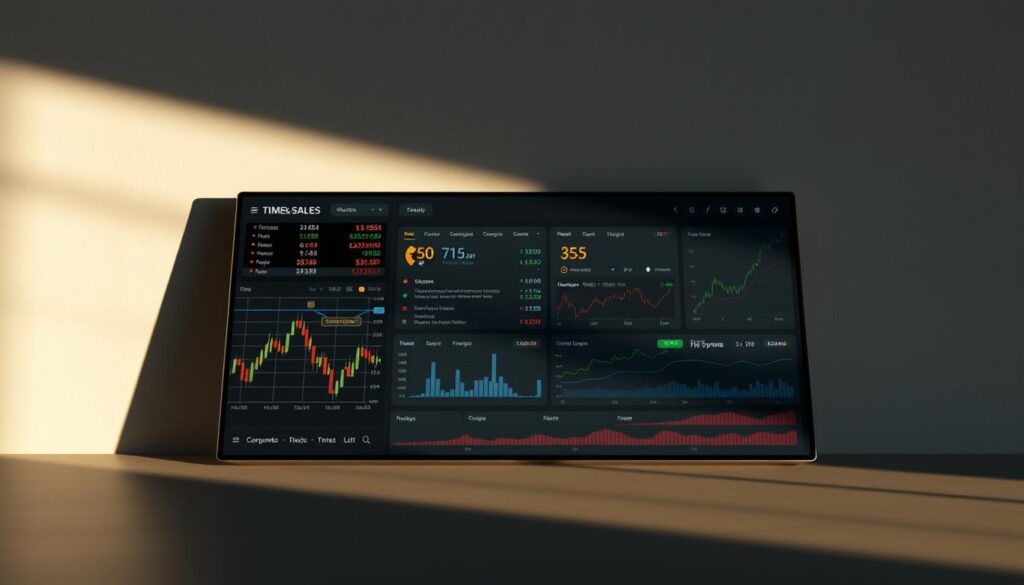
The ability to see real-time supply and demand dynamics transforms how traders interact with financial instruments. MT5’s advanced toolset offers a clear view of order flow, revealing buy and sell interest beyond immediate prices. This visibility helps users gauge liquidity and anticipate potential price movements across forex, stocks, and other assets.
For exchange-traded instruments, the platform displays actual bids and asks from participants. Over-the-counter (OTC) assets, however, rely on broker-provided quotes that adjust based on trade size. Understanding this distinction ensures traders interpret data accurately for their strategies.
Professional users particularly value how this functionality supports precise order execution. By observing layered price levels, they can time entries or exits more strategically. Retail traders gain access to insights once reserved for institutional players, leveling the playing field in fast-moving markets.
The seamless integration with MT5’s interface means updates occur without delays. Real-time information flow becomes critical when managing risk or capitalizing on short-term opportunities. Whether analyzing forex pairs or commodities, this feature serves as a cornerstone for data-driven decision-making.
An Introduction to the Market Depth Technology
Visualizing real-time order flow gives traders a competitive edge in fast-paced environments. The Depth of Market (DOM) acts as a window into the layers of buy and sell interest surrounding an asset. Unlike basic price charts, it reveals the volume of pending orders at specific levels, painting a clearer picture of supply and demand.
Understanding the Concept of DOM in Trading
The DOM displays live bids and asks, ranked by proximity to the current market price. For exchange-traded assets, this data reflects genuine participant activity. Each price level shows how many contracts or shares traders are willing to buy or sell. In over-the-counter (OTC) environments, brokers may generate quotes based on trade size, affecting accuracy.
This tool helps identify hidden liquidity clusters. For example, a dense concentration of buy orders at a lower price might signal strong support. Traders use these insights to anticipate breakout or reversal scenarios before they occur.
The Role of Liquidity and Price Levels
Liquidity assessment becomes precise when observing order volumes across the depth market. Thinly traded zones often indicate vulnerability to sharp price swings. Conversely, thick order stacks suggest stability, offering safer entry or exit points.
Price levels in the DOM also expose psychological thresholds. Round numbers like 1.2000 in forex frequently attract heightened trading activity. Recognizing these patterns allows traders to align strategies with collective market behavior.
Setting Up the Market Depth Feature in MT5

Accessing real-time order data starts with proper setup within your trading platform. The process involves activating the DOM through the Market Watch window and customizing display parameters to match individual preferences. These adjustments ensure traders efficiently analyze liquidity clusters and price action dynamics.
Activating DOM from the Market Watch
Begin by locating your preferred financial instrument in the Market Watch area. Right-click the asset and select “Depth of Market” from the context menu. This action opens the DOM window, revealing live bids and asks for exchange-traded assets. Note that availability depends on your broker’s infrastructure and the instrument’s exchange status.
Configuring Order Volume and Display Options
Customize the DOM window by adjusting volume measurements between lots or units. Traders can also modify the number of visible price levels through platform settings. Resize or reposition the panel to fit your workspace layout. Advanced features like tick charts or Time & Sales data can be toggled via the toolbar for enhanced analysis.
Market Depth Feature in MT5: Navigating Order Operations

Efficient trade execution relies on understanding how to interact with real-time price data. The platform categorizes actions into two primary methods: instant transactions and planned entries. This structure helps traders align their strategies with precise price levels and liquidity conditions.
Market Operations Versus Trade Requests
Market operations execute immediately at the best available price. Traders use this for urgent entries or exits, ideal when speed outweighs price precision. For example, closing a position during volatile news events often requires instant execution.
Trade requests, however, let users set predefined conditions. A buy limit order activates below current prices by clicking the bid area. Conversely, sell stop orders trigger in the bid zone when prices fall below specified thresholds. These tools help capture reversals or breakouts without constant monitoring.
Managing Pending Orders and Price Adjustments
Modifying pending orders becomes intuitive through the DOM interface. Traders drag limit or stop levels to new price points, adapting to shifting market conditions. Canceling unwanted requests takes one click, reducing clutter during fast-moving sessions.
Integrated stop-loss fields appear automatically when placing new orders. This ensures risk management aligns with entry strategies from the start. Adjusting trade sizes or profit targets works similarly, maintaining workflow efficiency.
Advanced Insights: Using Time & Sales and Tick Chart Data

Precision in trading often hinges on granular details hidden within transaction histories. MT5’s integrated Time & Sales and tick chart tools transform raw numbers into actionable insights. These features reveal patterns in buying and selling pressure that standard charts might overlook.
Interpreting Time & Sales for Trade Analysis
The Time & Sales window logs every executed trade with time stamps, direction, and volume. Blue markers highlight buy orders, while pink indicates sell activity. Traders spot institutional footprints by filtering large lots—like 100+ contracts—that suggest professional participation.
For example, rapid pink clusters near ask prices may signal impending downward momentum. Combining this with DOM bid levels helps confirm whether support zones hold. Exporting this data to CSV files allows deeper trend analysis beyond real-time monitoring.
Leveraging Tick Charts for Volume-Based Decisions
Tick charts display transactions as circles scaled by trade size. Larger circles represent heavy volume at specific price points. A dense cluster of green markers near 1.1200 in forex could indicate a potential reversal zone.
These visuals help traders identify hidden liquidity pockets. When paired with DOM ask prices, they reveal whether buyers or sellers dominate critical thresholds. Adjusting strategies based on these signals can improve entry timing during breakout scenarios.
Final Insights on Enhancing Trading Decisions with MT5
Adapting to price shifts becomes intuitive with layered order book insights. The platform’s visual interface lets traders adjust stop-loss and take-profit levels directly within the trade column. Simply drag these markers to new positions, aligning risk management with evolving market conditions.
Pending orders gain flexibility through real-time updates. Modify buy-limit or sell-limit prices by moving them across visible liquidity zones. This instant adjustment capability proves vital when capitalizing on sudden price movements or news events.
By revealing clustered order volumes at specific thresholds, the tool transforms reactive strategies into proactive decisions. Retail participants now access institutional-grade price-level analysis, narrowing the gap between casual and professional trading approaches. This fusion of speed and precision elevates strategic execution across forex and other instruments.
from
https://www.metatradermt4.com/metatrader-5/market-depth-feature-in-mt5/

No comments:
Post a Comment